
01
Ask
Start with a business question, an existing chart, or the underlying data.
Reports
Build live charts and dashboards that keep their sources, definitions, and freshness attached. When someone asks where a number came from, the answer is in the report.
Revenue by channel
Live model · refreshed 2m ago
Revenue
$284,910
+18.4%
ROAS
4.72×
+0.38
CAC
$41.20
−6.1%
One continuous workflow
Data prepares the records and rules. Data Studio builds the logic. Reports keep the chart and the final write-up connected to both, so the answer does not lose its context.
Start with a business question, an existing chart, or the underlying data.
Build the logic in Data Studio when the question needs more than the visual tools.
Open Data StudioCreate live charts that retain their source, filters, and definitions.
Turn the finding into a report or presentation-ready narrative.
Inside the workspace
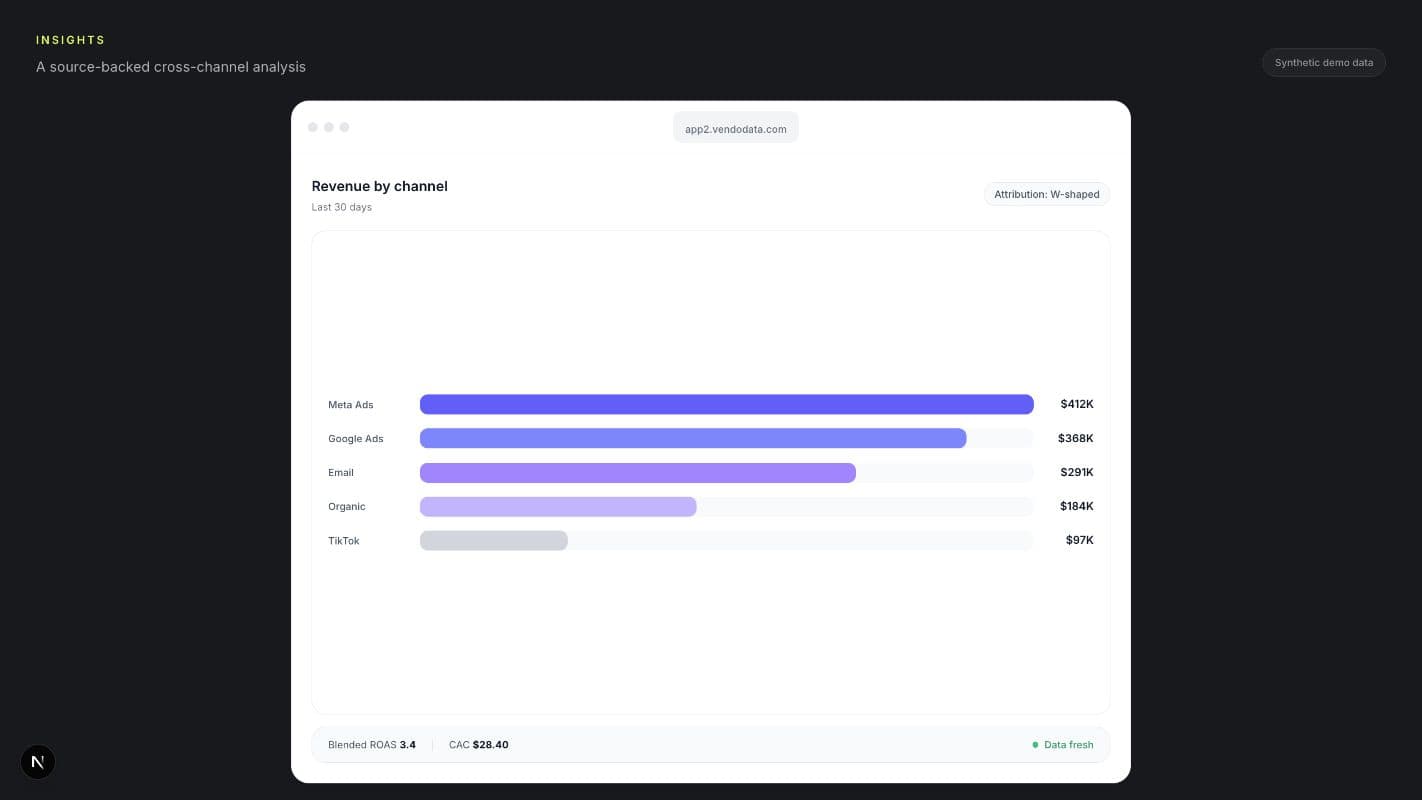
A chart is easier to trust when people can see how attribution was counted, which dates it covers, when the data last updated, and what each number means.
Reusable output
Turn an active chart into a report or presentation without rebuilding the analysis underneath it.
Weekly growth review
Live report · 6 sources
Executive summary
Revenue grew 18.4% while blended CAC fell 6.1%. Google and Email contributed the strongest efficient growth.
Recommended focus
Keep the visual connected to its model, filters, freshness, and shared metric definitions.
Combine the finding, supporting evidence, context, and caveats in one reusable report.
Create a polished narrative through the document integration without rebuilding the analysis.
No code required
Most reporting questions never need code. When one does, the same data and definitions are waiting in Data Studio, so nothing has to be rebuilt.
Explore Data StudioCreate common metrics, groups, and reports without starting from code.
Ask a question in plain language and inspect the working behind the answer.
FAQ